
Get ready for a fresh Inyova experience! We’re introducing a host of features that will take you even closer to your financial goals.
July 2023: What’s new
Apps: Customer Mobile App on iOS and Android
Version: 5.12.00
Your savings plan status at a glance
In the latest version of the Inyova app for your smartphone you’ll find a completely new experience under the “performance” tab. At the very top you’ll notice a new box that gives you an overview of your savings plan. To minimise the effect of strong market fluctuations on your portfolio and reduce the risk of buying at a “wrong” point in time, you can set up a standing order with which you can gradually add smaller amounts to your investment. This way, you can continuously build up your assets.
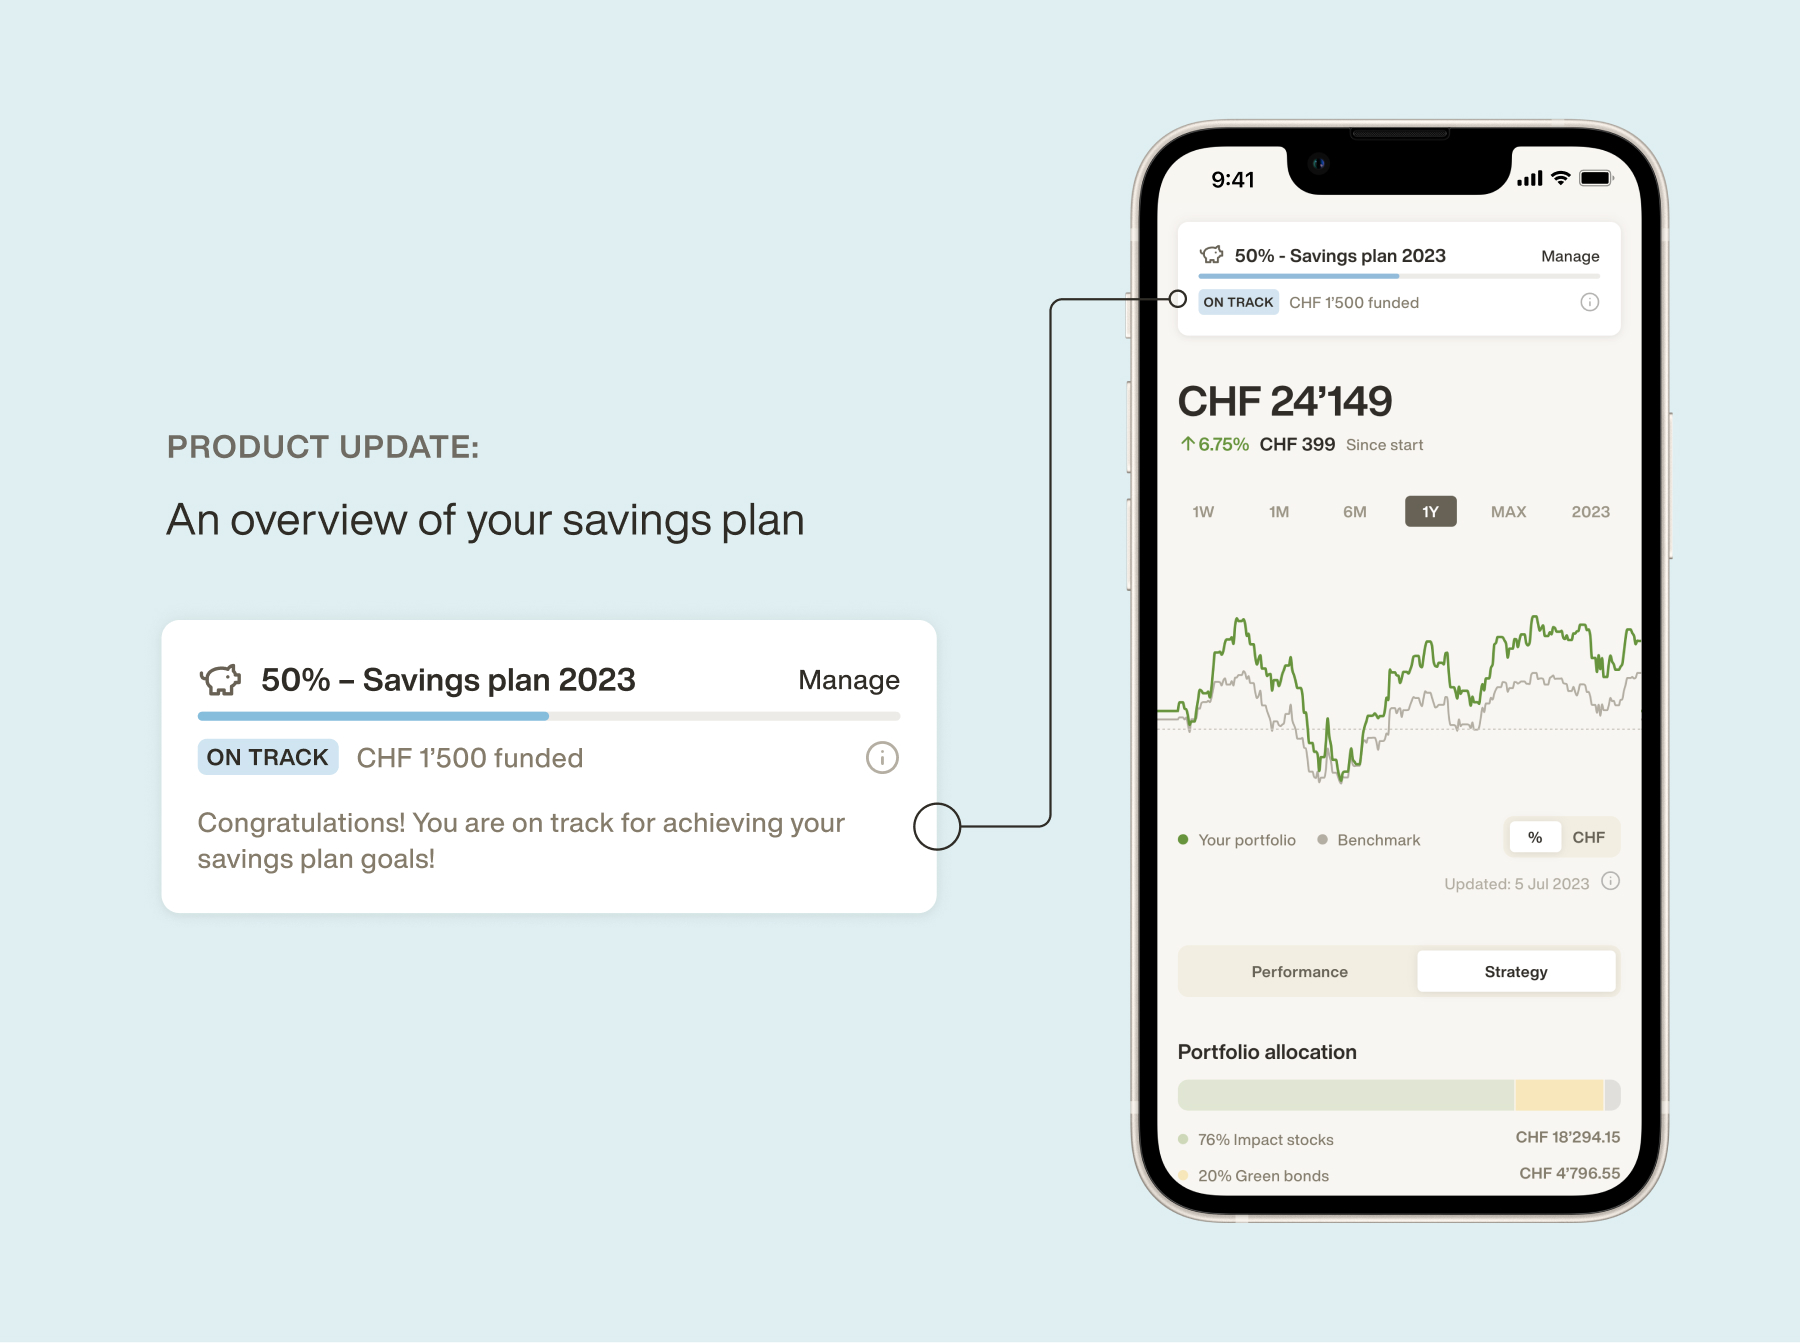
The new tab also gives you full transparency of your savings plan and regular payments – you’ll see your savings plan status and whether your savings plan playments are “on track”. The indicator will also remind you if you’re deviating from your yearly progress, so that you can intervene early.
More insights in the performance graph
As part of the update, we have also revised the performance graph. Some details will certainly look familiar to you. At the top you can see your current portfolio value, as well as the development in percent and CHF. These figures and the graph below are based on the time-weighted return (the return corrected for the effect of deposits and withdrawals). You can choose between different time periods, and between the percentage or value change.
This is new: The line colour shows you whether your portfolio has a positive (green) or negative (red) performance in the selected period. We have also added the development of a benchmark. The basis for this calculation is a mixed benchmark performance specifically for your portfolio strategy. This includes important benchmarks such as the DAX, the STOXX 600, the S&P 500 and the Solactive Green Bond Index. The performance of these indices is weighted according to the geographical distribution of your portfolio.
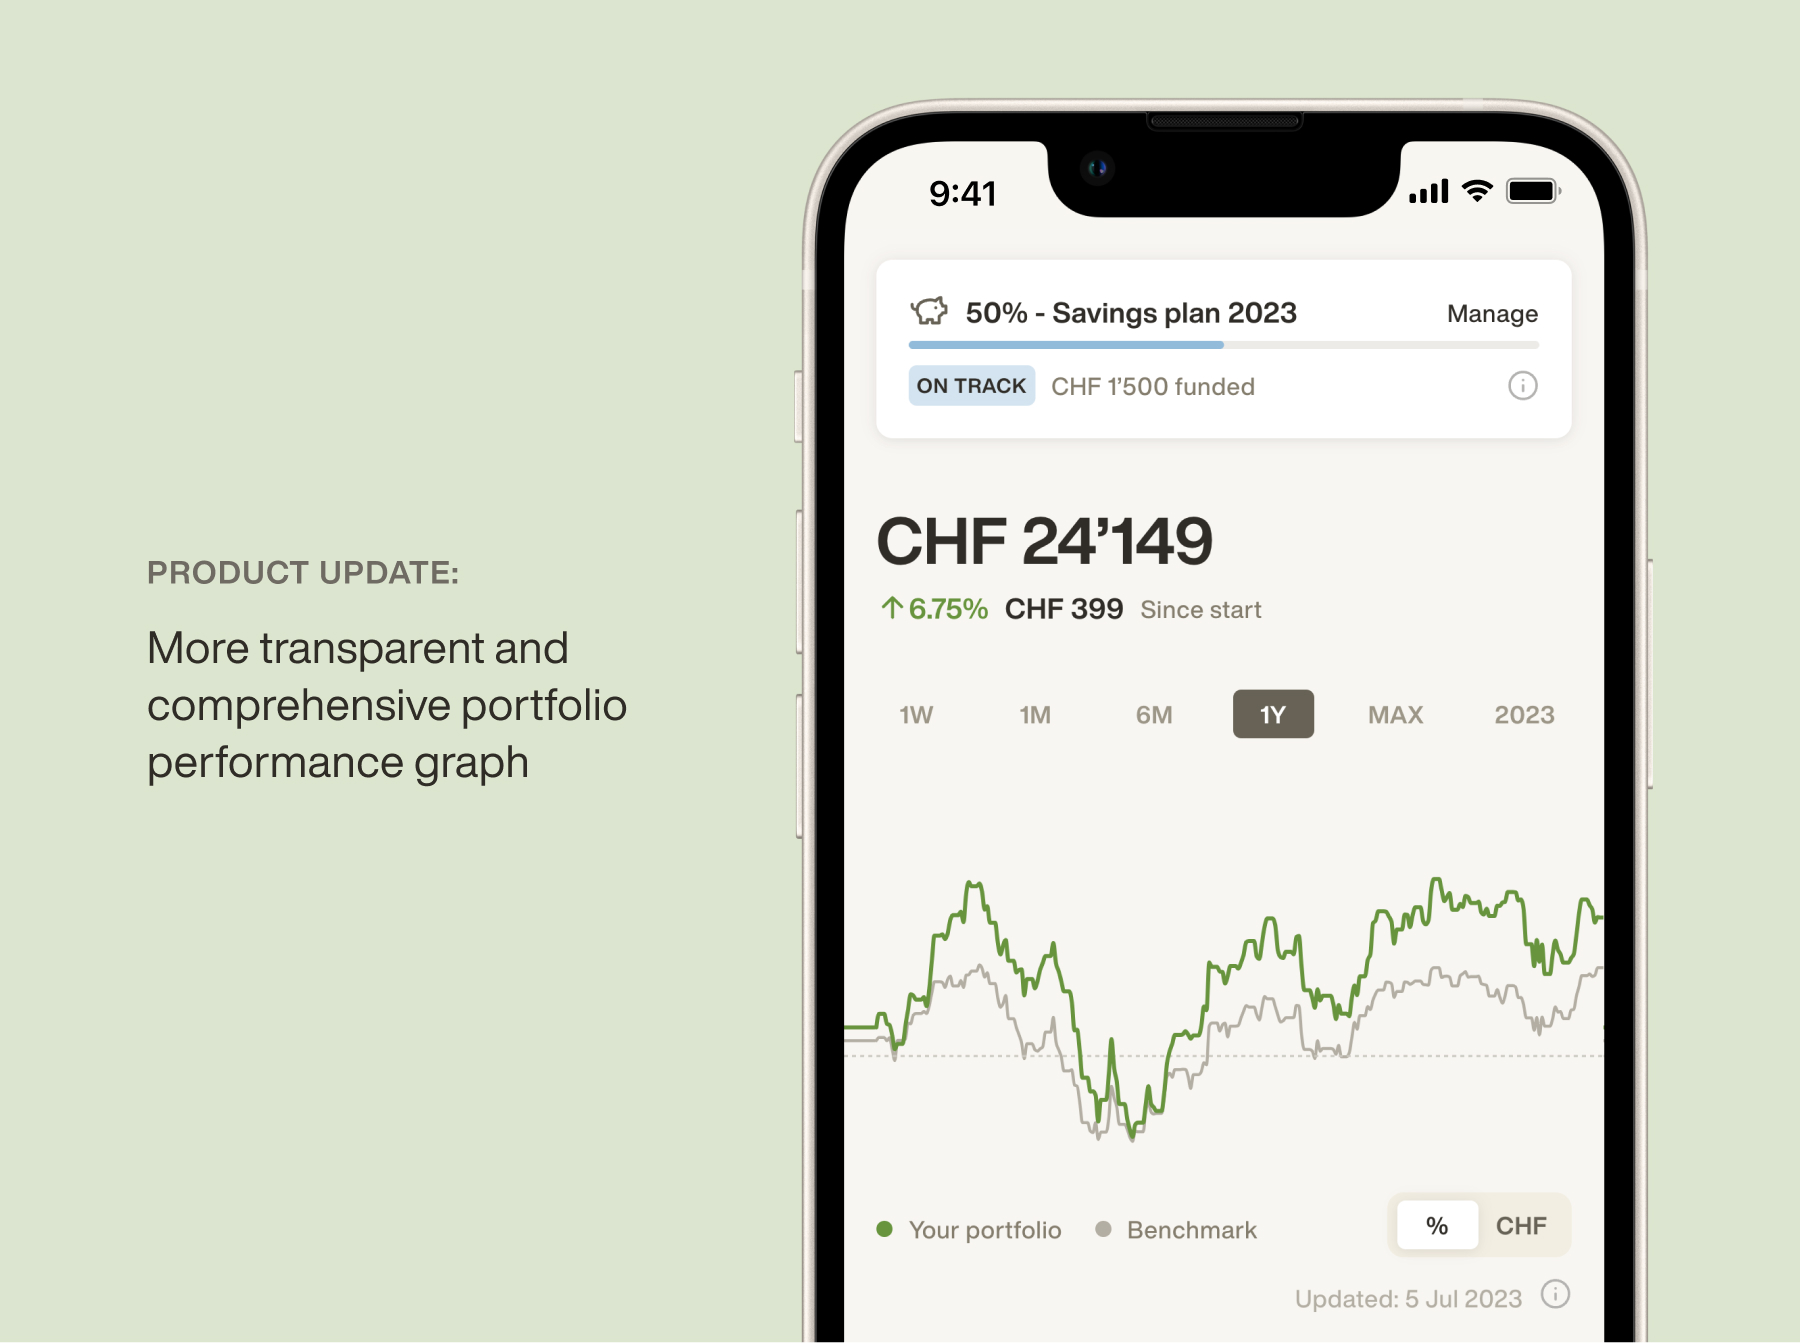
The update makes your portfolio performance even more transparent and comprehensible. Since the simple comparison of returns of different investments is often inapplicable (e.g. because investments were made at different times or are based on different risk profiles), we have created a possibility to compare your Inyova investment with a benchmark by integrating the mixed benchmark performance. This approach ensures an optimal market comparison and allows you to make an informed assessment of your Inyova performance.
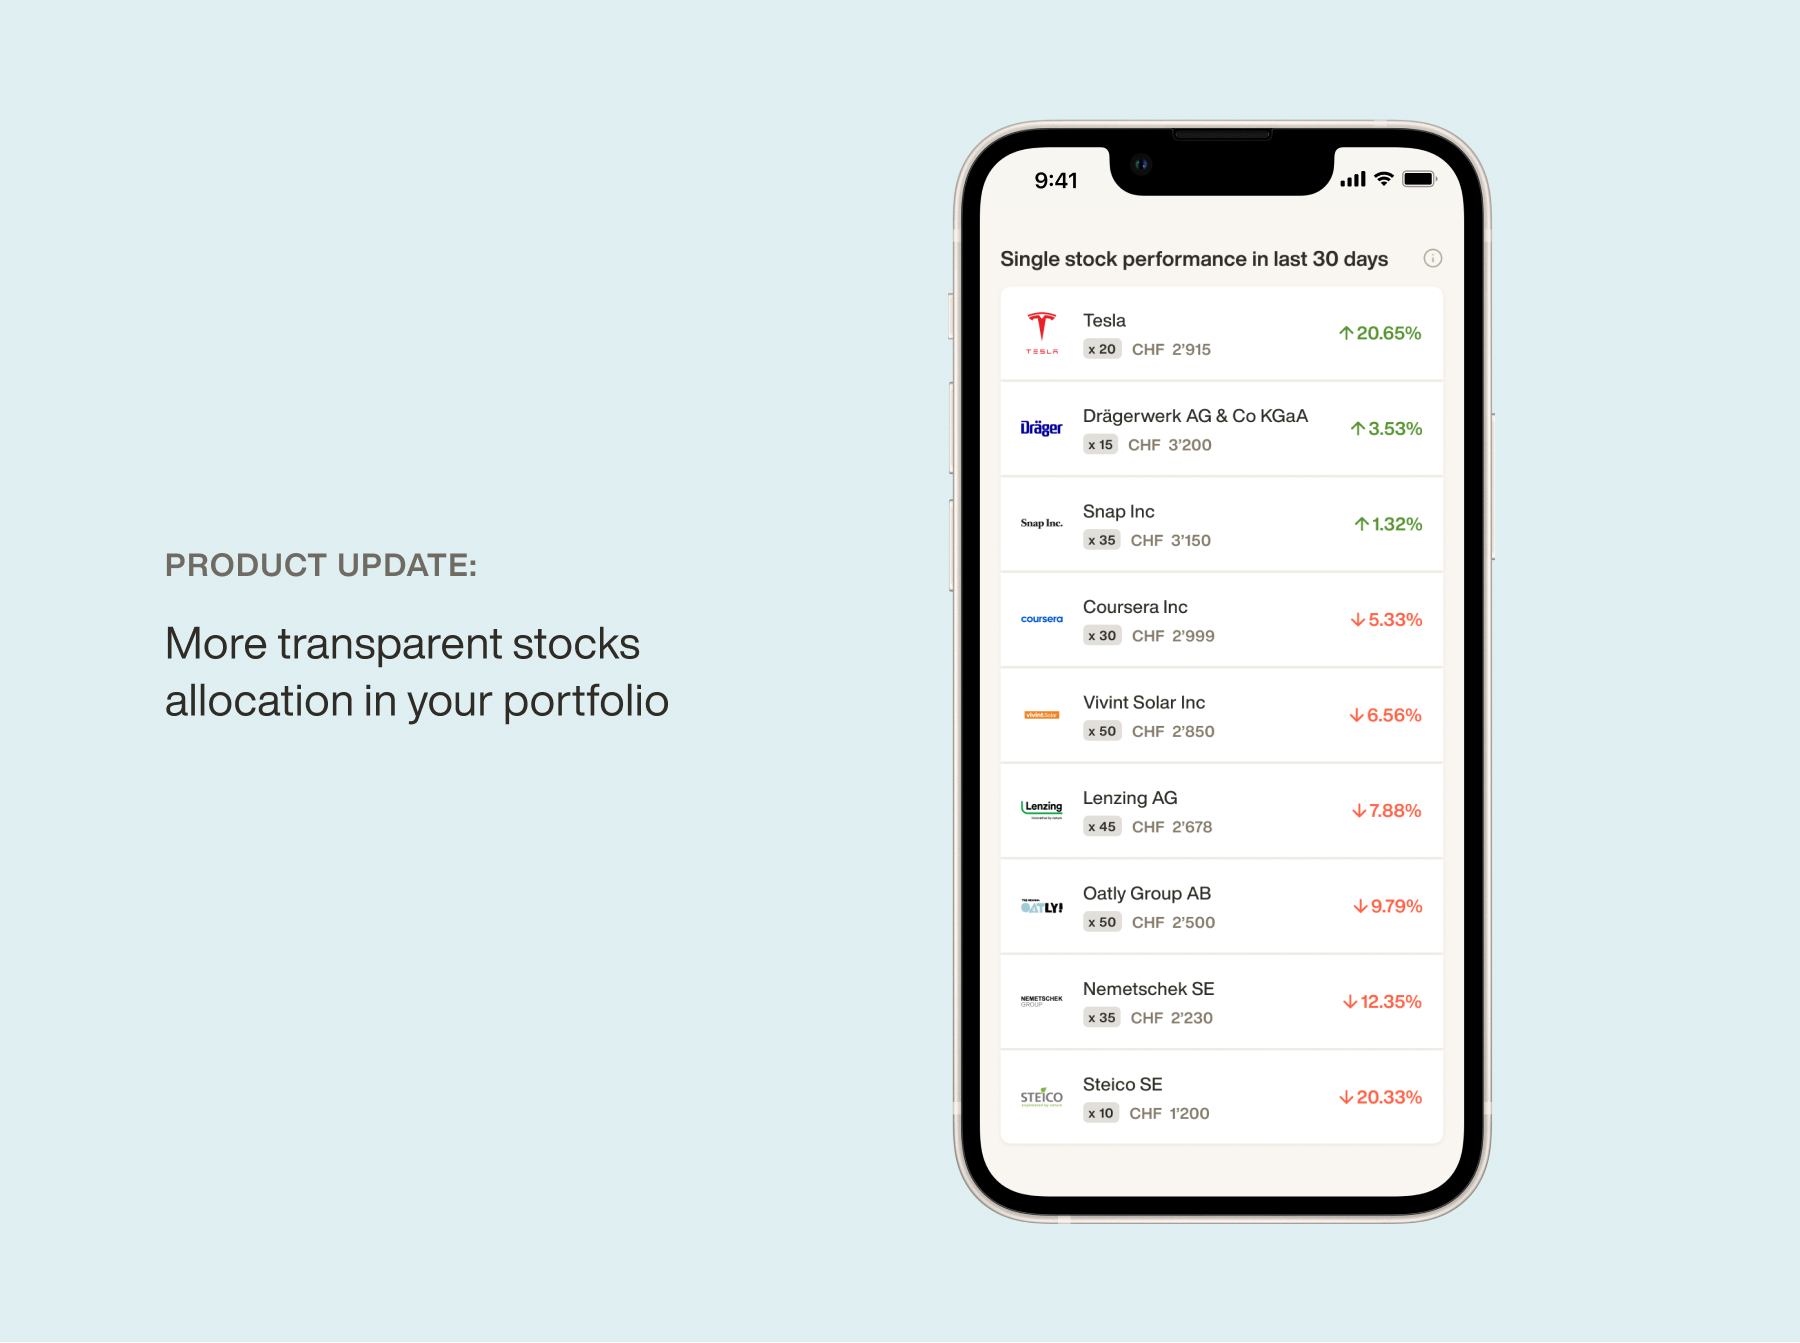
Increased transparency in your invested stocks
Until now, the single stock performance overview gave you an impression of how the individual stocks in your portfolio have developed over the last 30 days. In addition to this percentage development, the new update shows you the exact number of individual shares in your portfolio, as well as the corresponding value of the company shares held. With this extension, we’re increasing the transparency of the stocks allocation in your portfolio.
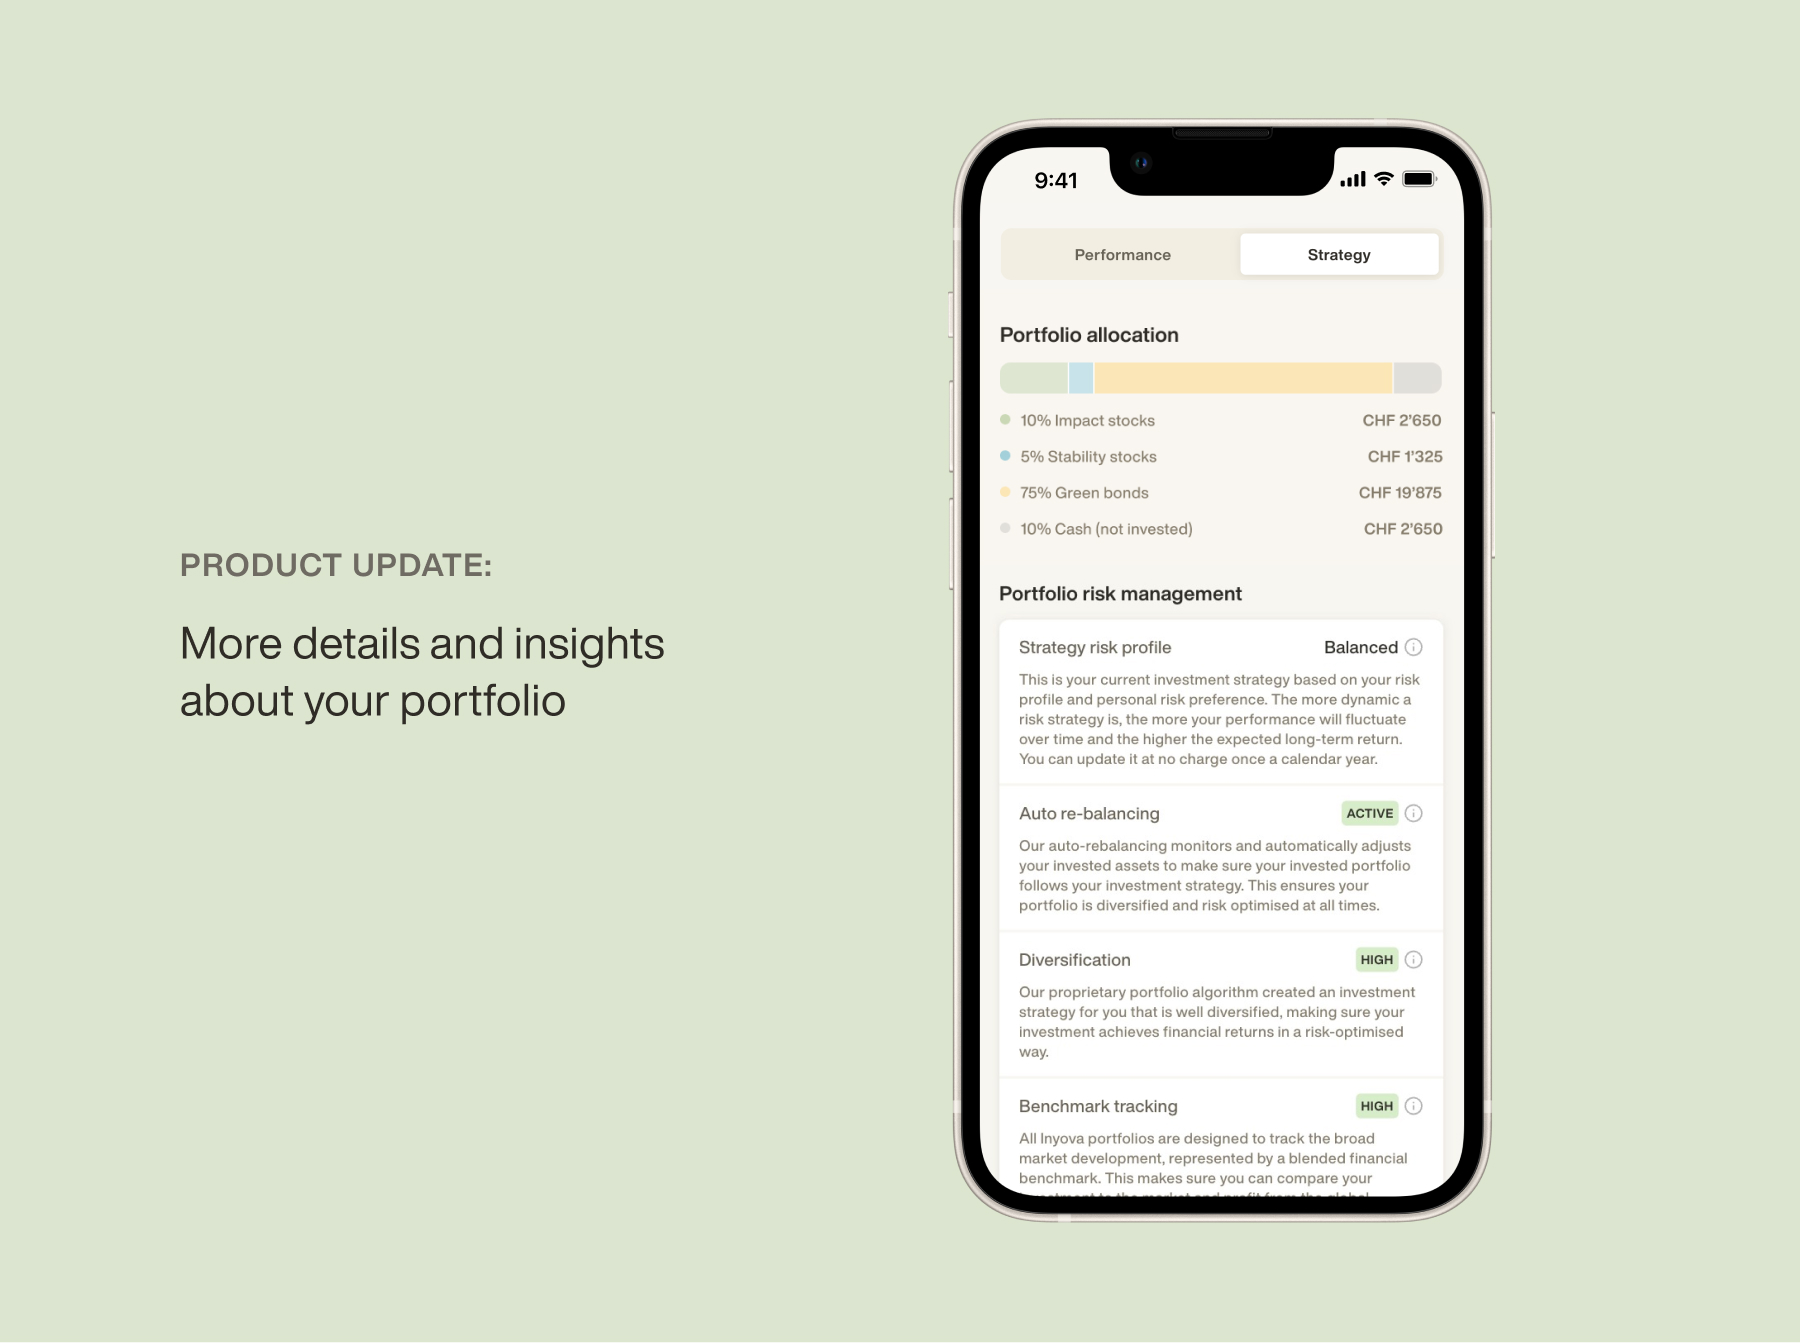
Better strategy insights
The update includes the integration of a new strategy overview. In addition to the breakdown of your portfolio into the different asset classes (impact stocks, stability stocks, green bonds and non-invested capital), you can now access more details about your portfolio. In the overview you can see which risk profile your investment corresponds to. You can also see which services are active for your account (automatic rebalancing, diversification, benchmark tracking). At the bottom under “portfolio review” you can also see when the next review of your portfolio by our investment team is taking place.
Update now


You are not an impact investor yet?
Create your own impact investing strategy here. Once you’re an Inyova impact investor you can make use of our mobile app to manager your investment.