You might have heard there’s no such thing as a ‘free lunch’. Whether it’s risk and potential return… or money and a sandwich… Something is usually changing hands when business is concerned.
However, some lunches provide great value, while others are expensive and disappointing. Investing is the same.
This isn’t about gut feelings or insider knowledge, or crystal ball predictions on what the market might do next. We have a much more reliable tool to optimise the expected returns of a Swiss investment, within your level of risk (get your free impact investing strategy here).
It’s based on the Nobel Prize winning ‘Efficient Frontier’ investing theory, pioneered by economist Dr Harry Markowitz back in 1952. It states that for each financial profile, there is a portfolio that maximizes the returns for that investor within the desired level of risk.
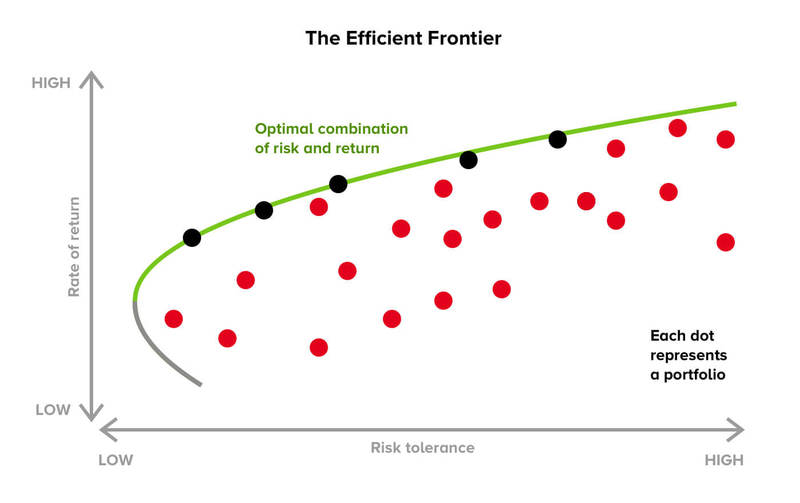
Let’s take a look at a graph showing Markowitz’s theory:

The green line is where you want your portfolio to be. This is the Efficient Frontier, where your potential returns are maximised at every risk level.
Notice how the Efficient Frontier spans from left to right, from not so risky to very risky. Where you will set depends on your risk profile (more about that in a moment).
Either way, we make sure your investment doesn’t stray far from that line.
On the horizontal axis, an investment is plotted according to the ‘standard deviation’ score for each asset. That score is basically the level of risk these stocks carry, based on how far they have swung up and down in the past. According to the Markowitz approach, you can assume stocks that have moved steadily are less risky than stocks that have moved like a seesaw.
On the vertical axis, each investment is positioned according to its historic rate of return. Markowitz made the assumption here that all investors are risk-adverse: they want to reduce their level of risk for a particular expected return.
Important note: Markowitz’s ‘expected returns’ are based on long-term investments – it doesn’t mean these returns are constant. There can be crashes such as Black Monday in 1987 and the more recent Global Financial Crisis in 2008, during which stock prices plunged by up to more than 50 percent. But in long term, stock prices have always recovered, in line with Markowitz’s theory on long-term profit expectations.
Of course, neither historical risk, nor historical returns are a perfect measure. Past performance and past volatility don’t predict what will happen tomorrow or next year. But in practice over six decades, the Efficient Frontier model has proven to be the most reliable tool for achieving returns.
Sounds great in theory… But how do you implement the Efficient Frontier?
Markowitz ‘Efficient Frontier’ theory is based on a complex analysis of all available stocks and markets. In fact, most international financial markets and stocks are so efficient, that a diversified portfolio of 35-40 stocks from companies, spread across different industries, geographies, currencies, and company sizes, can represent a similarly optimized and diversified portfolio.
By diversifying the portfolio this way, your exposure to downturns (in particular industries, currencies, and individual companies) is reduced.
Hypothetically, if the renewable energy industry descends into chaos, you won’t need to panic. That’s because instead of your portfolio being one or two giant investments, it consists of many smaller investments that are unlikely to crash all at once.
To further fine-tune your risk, we use a sovereign-bond ETF, which consists of loans to leading nations, e.g., the USA, Japan or Germany. These bonds are less volatile and less risky than stocks.
By adding this ETF, we allow our customers to obtain an investment portfolio that deviates as little as possible from the Efficient Frontier, while also taking into consideration their individual risk profile.
So, how do you calculate my risk level on the Efficient Frontier?
At Inyova, we feel great responsibility to our customers. That’s why your strategy is custom-built around your personal risk preferences and financial goals. You can adjust these under ‘risk profile’.
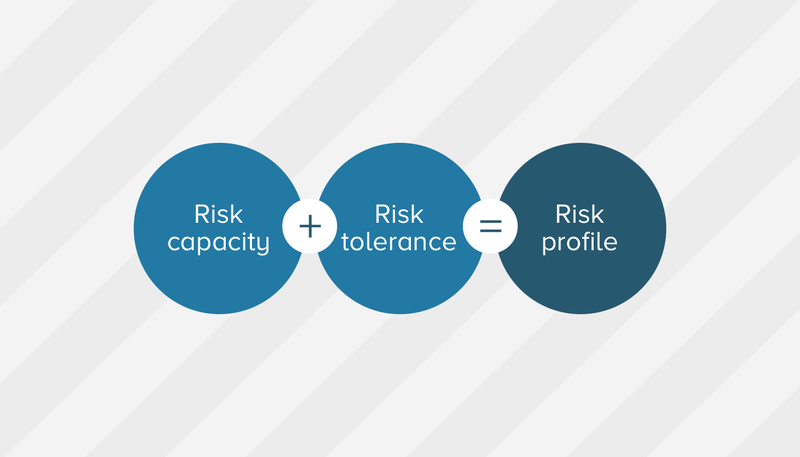
In assessing your risk profile, we look at two main elements:

Risk capacity: This determines how much risk you can financially afford to take on. We consider factors such as your income and total wealth, your age, and how many people depend on you for financial support.
Risk tolerance: This is the level of risk you are emotionally comfortable with (we don’t want you losing sleep at night). Everyone is different!
We also look at your goals. Say you want to buy a house in 5 years – in that case, we will design your portfolio so you have a nice nest egg to withdraw when that time comes. Your investment would likely sit on the left (the less risky side) of the Efficient Frontier.
On the other hand, say you’re saving for retirement. Depending on your age, that could be an investment period of 30 years or more. This longer time frame allows space to comfortably ride out occasional market downturns. If your risk capacity and risk tolerance stack up, we would build you an investment portfolio more to the right side of the Efficient Frontier.
I want in. Where do I sign up?
The first step is to get your personalised impact investing strategy – it’s free and non-binding. Using our easy online tool, you pick investment themes based on your personal values and interests. We show you exactly what stocks we recommend you invest in. You can also adjust your finanicial goals and risk preferences. With every adjustment you make, our algorithm makes sure your portfolio is financially sound. This way, you can control where your money goes – without compromising your returns.
If you’ve already accepted your strategy, congratulations! By investing, you not only support a company’s success, you become part of that success… growing your savings and having a positive impact on the world at the same time.


